As one of the world’s fastest-growing major economies, India serves as a core strategic fulcrum for Chinese enterprises expanding into South Asia and radiating their reach globally. Boasting an ultra-large consumer market, pressing industrial upgrading demands, favorable industrial policies and unique regional geopolitical advantages, India forms a high level of industrial complementarity with Chinese enterprises. It delivers multiple core values to Chinese businesses, including market expansion, capacity transfer and industrial synergy, emerging as a pivotal choice for them to seize opportunities from the global supply chain restructuring and the growth of emerging markets.
Today, Kunity will sort out the Q4 2025 market performance and future trends of the office leasing market in India’s four core cities—
New Delhi, Mumbai, Chennai and Bengaluru—from a professional perspective and based on the latest quarterly market data.
1. New Delhi Region
The activity of New Delhi’s office leasing market saw a notable uptick in Q4 2025 compared with the previous quarter:
The leased area increased by 2.1 million square feet in this quarter, with an annual rise of approximately 15.8 million square feet, a 24% growth from 2024; the net absorption in Q4 2025 stood at 1,264,013 square feet, and the annual net absorption reached about 10.9 million square feet.
The overall vacancy rate was 19.1%, a year-on-year decrease of 3.6%, with the total market stock at 149,742,030 square feet.
The total newly completed area for the whole year was 7,167,479 square feet, and the total under-construction area amounted to 22,229,711 square feet.
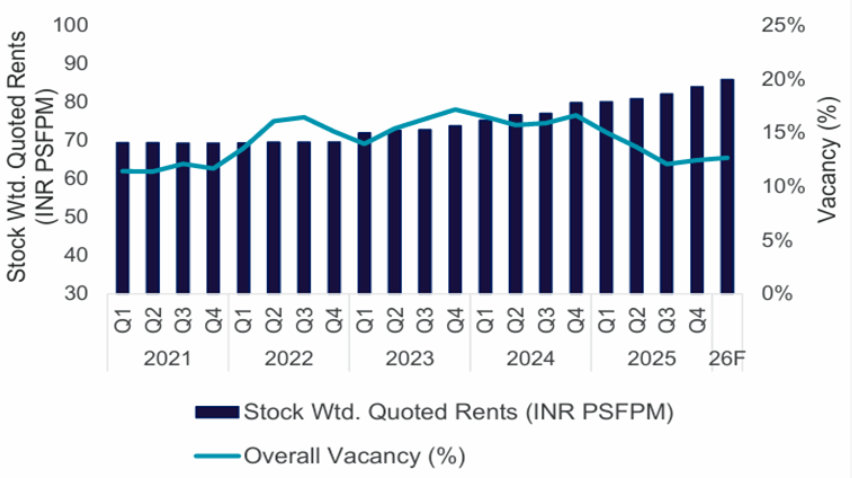
The average rent for Grade A office buildings in the overall market was INR ₹89.00 per square foot per month (approximately CNY 73.52 per square meter per month), while that for Grade A buildings in the CBD core area hit INR ₹284.00 per square foot per month (approximately CNY 234.66 per square meter per month).
In Q4 2025, the overall rental rates in New Delhi rose by 2–5% quarter-on-quarter and 6–8% year-on-year. The CBD area posted the most prominent growth, with a year-on-year increase of 12–15%.
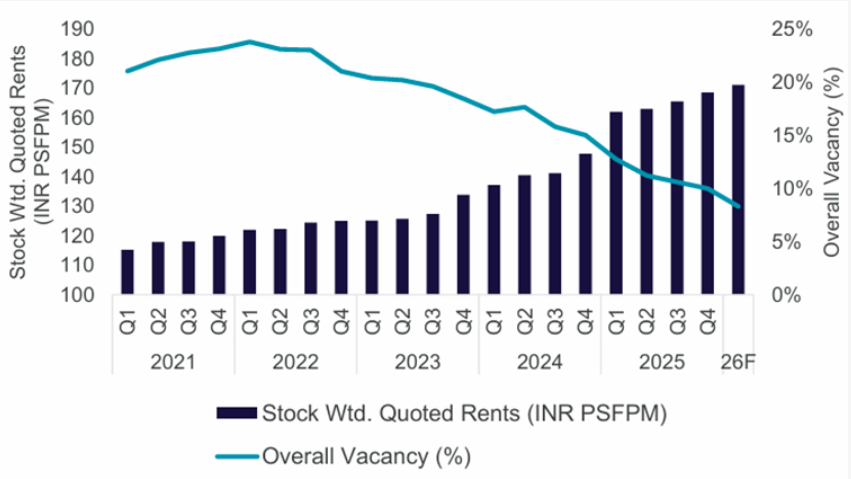
(New Delhi – Overall Rental Trend & Overall Vacancy Rate Trend Chart)
2. Mumbai Region

Mumbai’s office leasing market witnessed a sluggish performance in Q4 2025:
The leased area increased by about 4.3 million square feet in this quarter, with an annual growth of approximately 16.9 million square feet; the net absorption in Q4 2025 was around 2 million square feet, a sharp 51% year-on-year contraction, and the annual net absorption totalled 9,593,129 square feet.
The overall vacancy rate was 10.0%, a year-on-year decrease of 0.6%, with the total market stock at 123,299,616 square feet.
The total newly completed area for the whole year was 4,000,384 square feet, and the total under-construction area reached 25,744,711 square feet.
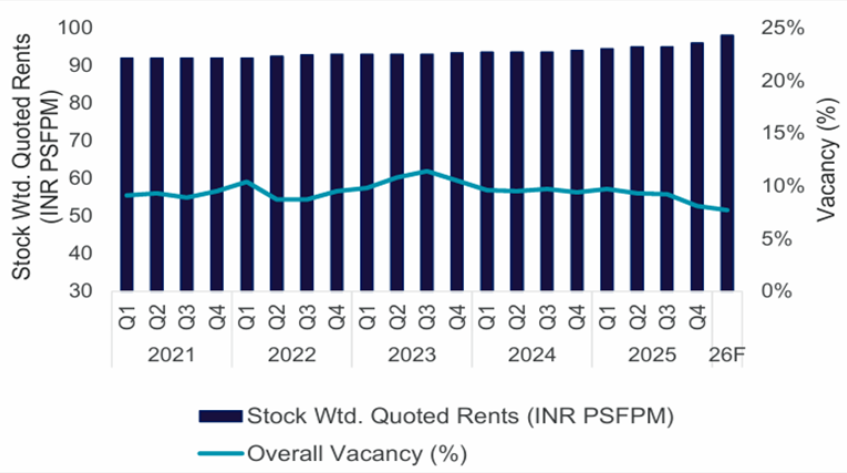
The average rent for Grade A office buildings in the overall market was INR ₹168.6 per square foot per month (approximately CNY 139.29 per square meter per month), and that for Grade A buildings in the CBD core area reached INR ₹352.20 per square foot per month (approximately CNY 291.07 per square meter per month).
In Q4 2025, the average rental rate in Mumbai edged up 1.9% quarter-on-quarter to INR 168.6 per square foot, driven by robust demand in key business districts such as Andheri-Kurla Road and Lower Parel. The sustained rise in demand for high-end office space in the overall market will continue to exert upward pressure on Mumbai’s average rental levels in the coming quarters.
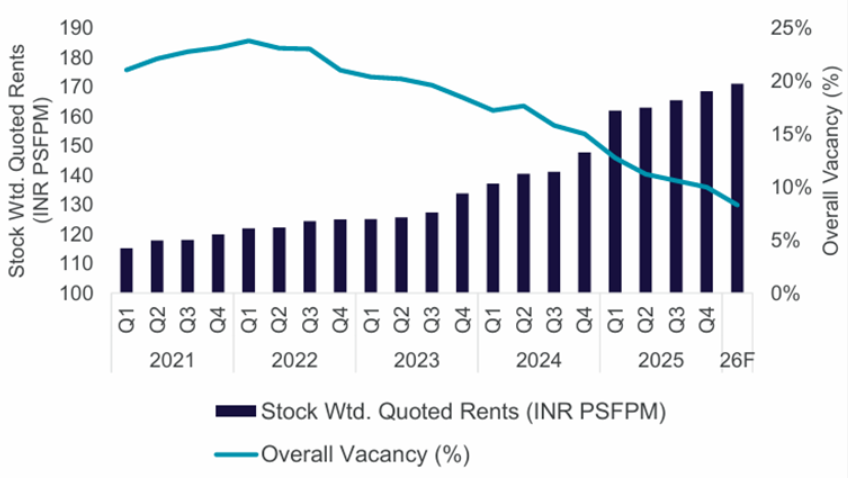
(Mumbai – Overall Rental Trend & Overall Vacancy Rate Trend Chart)
3. Chennai Region
Chennai’s office leasing market saw a slight decline in activity in Q4 2025 compared with the previous quarter, but delivered an outstanding performance for the full year:
The leased area increased by about 2.02 million square feet in this quarter, a 5% year-on-year decrease; the annual leased area rose to 8.99 million square feet, a 23% year-on-year growth; the net absorption in Q4 2025 was around 1,665,292 square feet, and the annual net absorption totalled 7,021,357 square feet, setting a new annual net absorption record for Chennai.
The overall vacancy rate was 12.4%, a year-on-year decrease of 4.0%, with the total market stock at 73,320,627 square feet.
The total newly completed area for the whole year was 4,746,256 square feet, and the total under-construction area amounted to 21,165,940 square feet.
The average rent for Grade A office buildings in the overall market was INR ₹83.97 per square foot per month (approximately CNY 69.43 per square meter per month), and that for Grade A buildings in the core area reached INR ₹105.30 per square foot per month (approximately CNY 86.98 per square meter per month).
In Q4 2025, the city-wide average rental rate in Chennai rose by 2% quarter-on-quarter and 6% year-on-year. Submarkets such as the outer southwest, outer northwest and outer southern areas recorded a notable rental uptick, with a quarter-on-quarter growth of 5-6%. The total newly completed area in 2025 doubled that of 2024. Despite the substantial supply increase, Chennai still set its highest-ever annual net absorption, thanks to the high pre-leasing rate in newly completed projects and the continuous take-up of new space. This underscores the market’s strong demand and its ability to absorb a large amount of new supply.
(Chennai – Overall Rental Trend & Overall Vacancy Rate Trend Chart)
4. Bengaluru Region

Bengaluru’s office leasing market maintained its year-round robust activity in Q4 2025, leading to an excellent full-year performance:
The leased area increased by about 7.6 million square feet in this quarter, hitting the second-highest quarterly record in history; the annual leased area rose to approximately 22 million square feet, also setting the second-highest annual record ever; the net absorption in Q4 2025 was around 4,887,000 square feet, and the annual net absorption totalled 14,351,154 square feet, a slight increase from 2024.
The overall vacancy rate was 8.1%, a quarter-on-quarter decrease of 1.1%, with the total market stock at 213,601,985 square feet.
The total newly completed area for the whole year was 12,621,598 square feet, and the total under-construction area reached 43,660,878 square feet.
The average rent for Grade A office buildings in the overall market was INR ₹96.0 per square foot per month (approximately CNY 79.33 per square meter per month), and that for Grade A buildings in the core area reached INR ₹162.1 per square foot per month (approximately CNY 134.02 per square meter per month).
In Q4 2025, strong demand in Bengaluru drove quarter-on-quarter and year-on-year growth in office rental rates. Rents are expected to rise further in the near term, mainly fuelled by the active transactions of newly built Grade A/Super Grade A office buildings in the core regional market.
(Bengaluru – Overall Rental Trend & Overall Vacancy Rate Trend Chart)